Dec 18, 2025

Business intelligence is like turning scattered jigsaw pieces into a clear landscape. For an SME, those pieces might be sales figures, customer reviews or trend data. BI helps you spot opportunities and risks fast, so you’re not reacting—you’re staying ahead.
Why Business Intelligence Matters
Picture dozens of spreadsheets and email threads hiding your next big chance. A small retailer, for instance, can bring sales and customer feedback into a single hub with Weavely.ai forms, capturing shopping habits without extra IT resources. Concerned BI means high cost or tricky setups? Many SMEs start with low-cost, no-code tools like Weavely.ai to collect feedback and feed it straight into analytics in just a few clicks.
Once everything is in one place, run ETL (extract, transform, load) workflows that clean up messy inputs and merge them into a unified view. Next, analytics reveal patterns you might otherwise miss, and dashboards serve up those insights in real time, steering your actions with clarity.
Spot seasonal demand shifts instantly
Tailor promotions based on live feedback
Track top-selling products by region

BI At A Glance
Below is a quick summary of BI’s main building blocks and how they deliver value.
Component | Purpose | Example |
|---|---|---|
Data Collection | Gather inputs from sales and feedback | Small retailer collects customer preferences with Weavely.ai |
ETL | Clean and organise raw data | Automate prep of daily sales CSV |
Analytics | Analyse trends and patterns | Model weekly revenue growth |
Dashboards | Visualise metrics in real time | Interactive dashboard showing top products and inventory levels |
Actionable Next Steps
Sign up for Weavely.ai and build your first feedback form
Load historical sales files into your BI platform
Create an initial dashboard to track weekly metrics
With these steps, you’ll be using BI in days, not months. Ready to explore each component step by step today?
Evolution Of Business Intelligence In The Benelux Region
Back in the early 2000s, most Benelux companies juggled spreadsheets and basic reporting tools. It felt like stitching together a patchwork quilt—each team held a piece of data but nobody saw the full picture.
By the mid-2000s, factories in Flanders built simple on-prem dashboards to count units rolling off the line. Meanwhile, e-government pilots started gathering citizen feedback online. Yet, those data silos moved insights at a snail’s pace.
Early Data Reporting Takes Shape
Manufacturers ran static reports to check output levels and quality metrics
Local councils sent out paper or web forms to capture resident opinions
Retailers generated end-of-day sales summaries on in-house servers
As cloud services gained traction around 2015, barriers fell. Teams could peek at near-real-time figures and collaborate across borders. The BI market in our region exploded—by 2024 it had swelled to €4.2 billion, fuelled by a Netherlands that ships over €700 billion in exports each year. Precedence Research forecasts spending will jump from €4.48 billion in 2025 to €9.1 billion by 2034 at a 7.26 % CAGR. Read the full research about the business intelligence market at HG Insights Learn more
Antwerp Port’s integration of IoT and BI cut fuel use by nearly one-fifth, demonstrating clear ROI and efficiency gains.
Cloud-Driven Insights And Integration
Today, export-focused industries and nimble SMEs alike tap into unified platforms. Customs offices, for instance, push declarations through smart forms built with Weavely.ai—no heavy IT lift required.
Modern BI tools now deliver:
Real-Time Dashboards for sales, inventory and logistics
Predictive Analytics that spot demand shifts before they happen
Automated Reporting to free teams from manual data wrangling
This journey—from scattered spreadsheets to sleek, cloud-powered insights—shows how business intelligence has evolved into a strategic must-have. Next steps include scaling those insights across every department, turning data into decisions at every level.
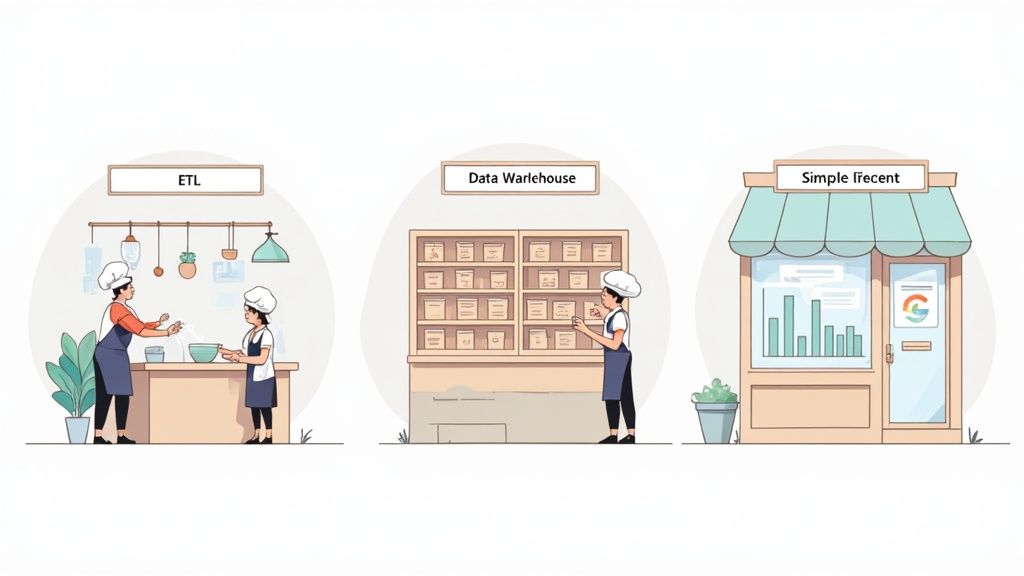
Key Concepts And Core Components
Imagine a restaurant kitchen where raw ingredients arrive in bulk and must be washed, trimmed and prepped before they hit the pan. In BI, data sources are those fresh ingredients. They flow in from every corner of your operation and need a bit of refinement to shine.
Collecting Data With Smart Forms
Before you can cook, you need ingredients on the counter. That means gathering info from sales terminals, web visits and customer comments. Smart forms from Weavely.ai take the pain out of surveys, lead captures and support logs. They slot right into your analytics setup with hardly any fuss.
Common sources:
Point-of-sale systems logging each transaction
Website analytics recording visitor journeys
Customer feedback forms for reviews or new leads
Set up your Weavely.ai forms once and watch them feed clean, timestamped entries (complete with product IDs and location codes) directly into your data pool.
Data Preparation With ETL
With ingredients on the counter, it’s time for prep. ETL (Extract, Transform, Load) is like the chef’s prep station—chopping, sorting and seasoning happen here.
ETL tasks include:
Removing duplicate or corrupt entries
Merging customer records from multiple systems
Converting various file types into standard formats
Validating ranges (dates, prices, quantities)
Scheduling nightly or hourly data loads
Automating these routines frees your team from repetitive work and slashes careless mistakes.
Managing Data Storage
Once prepped, ingredients need a pantry. In BI, that’s your data warehouse—a central library where every table, row and column is catalogued for instant retrieval.
Storage options:
Cloud warehouses that expand on demand
On-premises servers for total control
Hybrid models combining both approaches
Role-based permissions lock down sensitive sections while audit trails record every edit, so you always know who touched what and when.
Turning Data Into Insights
With everything lined up, analytics sprinkle the magic. They uncover patterns a human eye might miss—like the chef tasting a sauce and tweaking spices until the flavour’s spot on.
“Analytics help teams find patterns hidden in mountains of information.”
Typical analytics features:
Trend forecasting to predict sales or demand
Segment analysis by customer profile or purchase history
Anomaly detection to highlight sudden dips or spikes
Teams use these insights to drive KPI dashboards, tracking metrics like revenue growth, churn rates and customer lifetime value.
Visualising Results With Dashboards
Dashboards are your storefront window, displaying top-line insights at a glance. Well-crafted visuals turn columns of numbers into clear stories that everyone can grasp.
Dashboard Type | Best For | Example |
|---|---|---|
Executive Summary | High-level trends | C-suite scorecard |
Operational | Day-to-day metrics | Shop-floor KPIs |
Analytical | Deep dive research | Customer segmentation |
Choose your dashboard style based on the audience’s questions. Set alerts or thresholds so teams get notified as soon as a metric veers off course.
Integrating Real-Time Feedback
Closing the loop between customer sentiment and your BI platform sharpens every decision. Weavely.ai forms feed responses directly into your ETL pipeline, updating dashboards without human intervention. That real-time feedback can boost campaign performance by 20 %, according to SMEs who’ve tried it.
Quick wins include:
Adjusting promotions based on live satisfaction scores
Spotting product issues before they escalate
One small retailer saw repeat purchases jump by 15 % simply by weaving live feedback into their BI reports.
Business intelligence is the practice of turning raw data into clear, actionable insights through a mix of strategies, technologies and tools. In the Benelux region, cloud-based BI adoption climbed from 45 % in 2020 to 68 % in 2023, powering predictive maintenance that accounts for 18 % of Belgium’s GDP. Discover more insights about BI growth in the Benelux region on MarketsandMarkets.
You might be interested in our guide on page load speeds and user retention.
With these core components in place, SMEs can transform scattered data into timely, confident decisions. Next, we’ll walk you through a step-by-step BI implementation roadmap.
Key Takeaways
ETL Prepares Ingredients For Reliable Analysis
Warehousing Organises Data For Quick Retrieval
Analytics Convert Numbers Into Actionable Stories
Dashboards Present Insights In Engaging Visuals
Real-Time Feedback Closes The Loop With Customer Input
Choosing BI Tools
Selecting the right toolkit sets you up for success. Aim for platforms that cover ETL, warehousing, analytics and dashboarding—without locking you in.
Ensure compatibility with Weavely.ai for seamless feedback ingestion
Compare pricing based on data volume and active users
Look for vibrant support communities and comprehensive documentation
A small pilot project reveals the true learning curve and expected outcomes. Gather user feedback early, refine your data flows and only then scale across the business.
Focusing on core components first saves time and budget when you expand your BI footprint.
At Digifox, we help SMEs map out these ingredients and choose the best AI-friendly tools. Our consultancy takes you from defining key metrics to launching interactive dashboards—fast.
Ready to build your BI kitchen and serve insights daily? Contact Digifox to get a plan and kick off your analytics journey.
Practical Use Cases And Measurable Benefits
Small business owners often worry that BI means hefty price tags and steep learning curves. Yet, when you see data-driven decisions in action, those concerns melt away.
Below are real-world stories—from retail to finance—that highlight challenges, the BI fixes applied and the hard numbers that followed.
Ecommerce Use Case
A local fashion boutique noticed many customers bought once and vanished. They wanted a simple way to re-engage those one-time shoppers.
They fed past purchase data into a fresh BI dashboard and paired it with personalised Weavely.ai feedback forms.
Challenge: Fragmented sales and browsing records
BI Solution: Integrating Weavely.ai feedback forms for customer preferences
Outcome: 25 % jump in repeat orders and 15 % uplift in average order value
This proves that small tweaks—like embedding a form—can automate data flows and drive real growth.
Professional Services Benefits
An accounting consultancy faced peaks and troughs in project work, making staffing a guessing game.
They rolled out smart surveys, merged that feedback with billing data, then visualised demand patterns.
Gather client satisfaction scores via Weavely.ai
Run ETL jobs to combine survey insights with invoice records
Build a heatmap to pinpoint busy and slow cycles
“We cut idle hours by nearly a fifth, thanks to insights from our BI dashboard.”
SaaS Growth Insights
A B2B SaaS vendor struggled to hold onto trial users. They needed early warning signs to intervene before customers slipped away.
By streaming live usage logs and support-ticket data into predictive models, they spotted disengagement early.
Data Collection: Real-time event logs and ticket forms
Analytics: Models forecasting user drop-off
Outcome: 22 % reduction in churn and £30 k saved in onboarding costs
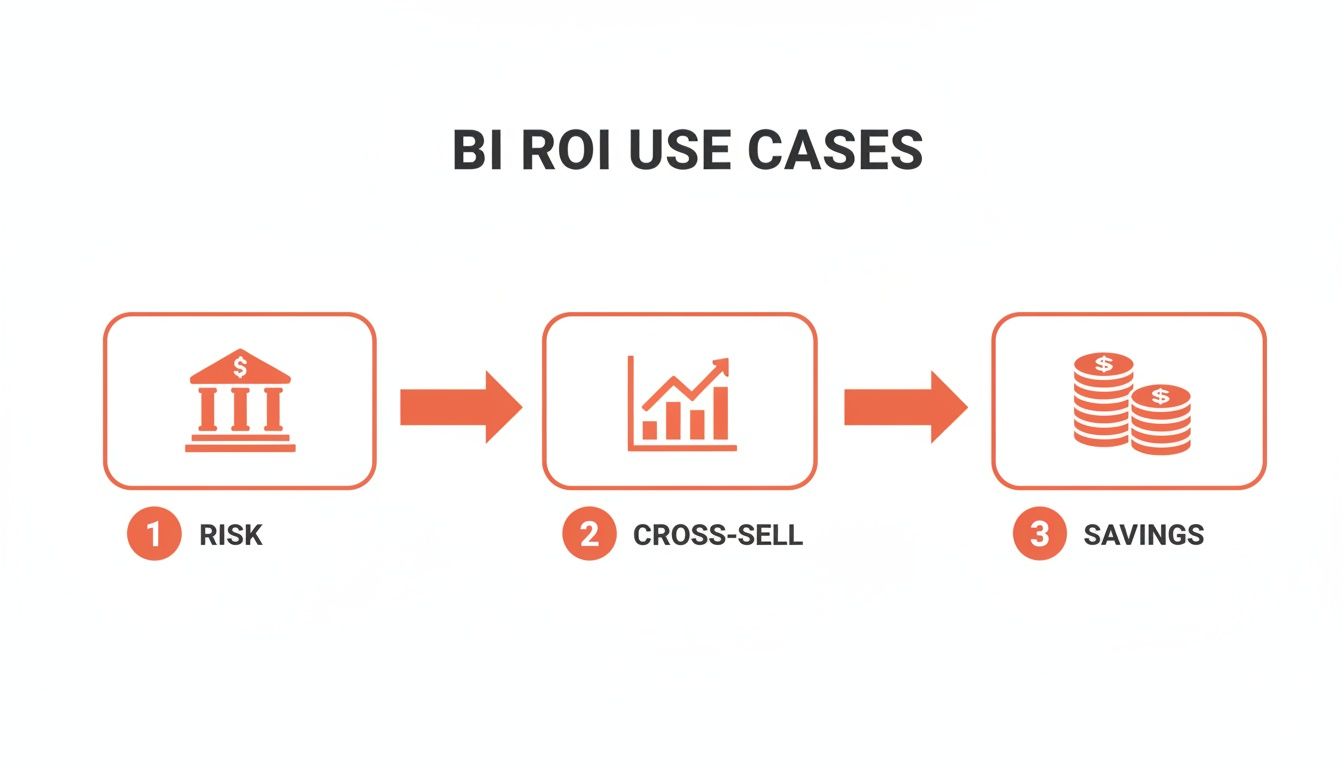
BFSI Results
Large banks in the Benelux have also seen big wins. Belgian institutions invested €450 million to sharpen risk assessments and achieved a 28 % boost in accuracy. ING Bank went deeper—analysing 500 million interactions to lift cross-sell by 19 % and trim €120 million in costs.
Read the full research about BI adoption in BFSI on Precedence Research
“Predictive analytics reduced loan default errors and sharpened decision-making.”
Even major financial players rely on the same core BI components that SMEs can deploy with a fraction of the budget.
BI Use Cases And ROI Comparison
Industry | Challenge | BI Solution | ROI Impact |
|---|---|---|---|
Ecommerce | Low repeat purchases | Personalised dashboards with Weavely.ai forms | +25 % repeat orders, +15 % AOV |
Professional Services | Uneven staffing demand | Forecasting via client feedback surveys | –18 % idle hours |
SaaS | High trial churn | Predictive analytics and live usage dashboards | –22 % churn, £30 k cost savings |
BFSI | Inaccurate risk assessments | Predictive models on customer interactions | +28 % accuracy, 19 % cross-sell |
Check out our guide on how great web design supercharges your marketing strategy for ideas on optimising your digital presence.
Many SMEs hesitate, fearing massive upfront spend. In reality, modular cloud solutions let you pay as you grow. You can launch a single dashboard in days and scale features later.
Efficiency gains often cover costs in under six months.
Ready to explore what BI can do for your SME? Contact Digifox to plan a pilot and unlock data-driven growth. Use Weavely.ai forms today to capture your first dataset in minutes and power your BI pilot.
Visit digifox.be to book a free consultation and start your AI journey with confidence today.
Step By Step Implementation Roadmap
This roadmap breaks down your BI journey into five clear phases with checklists and bite-sized tips so you can show results fast.
Phase One: Assess Data Maturity
Phase Two: Choose Collection Methods
Phase Three: Design ETL Workflows
Phase Four: Build Analytics And Dashboards
Phase Five: Run A Pilot And Refine
Phase One: Assess Data Maturity
Begin by taking stock of every data source you have—sales spreadsheets, website logs, customer surveys. Spot where information is patchy or out of date.
Checklist
Catalogue all spreadsheets, databases and form responses
Score each source on accuracy and completeness
Set three clear objectives (for example, cut churn by 10 %)
Quick Tip
Use a simple scoring grid in a spreadsheet to flag any data weak spots.
Phase Two: Choose Collection Methods
Decide how to fill gaps without endless admin. Embedded Weavely.ai forms can capture live inputs via email or on your site, feeding structured data straight into your analytics setup.
Checklist
List missing data points (sales, NPS, product usage)
Select form types—surveys, registrations or support tickets
Standardise fields for dates, IDs and ratings
Quick Tip
Limit each form to five questions or fewer to keep completion rates high.
You might also explore adding a chatbot for instant guidance on your site. Check out our article at Digifox.
Phase Three: Design ETL Workflows
Outline your extract-transform-load steps so data arrives clean and ready. Automation is your friend.
Checklist
Pick a user-friendly ETL tool or script
Schedule cleaning routines regularly
Validate transformed data against sources
Quick Tip
Run workflows on a small sample first to spot hiccups early.
Phase Four: Build Analytics And Dashboards
Choose platforms that plug straight into your data warehouse. Dashboards should tell a story at a glance.
Checklist
Define KPIs tied to business goals
Use drag-and-drop builders or templates to speed things up
Set alerts for thresholds you need to watch
Quick Tip
Invite end-users into the design process, then tweak layouts based on their feedback.
Phase Five: Run A Pilot And Refine
Roll out your solution with a limited dataset or single department. Prove value and adjust fast.
Checklist
Compare pilot results to Phase One objectives
Collect user feedback on usability and accuracy
Fine-tune workflows based on what you learn
Quick Tip
Keep review cycles short—iterate fast to lock in quick wins.
Launching BI in clear, manageable stages avoids overwhelm and ensures you hit your targets.
“A clear, stepwise launch often cuts BI ramp-up time by 30 %,” notes our consultancy experience.
Key Takeaways
Break adoption into five phases to stay focused
Use Weavely.ai forms early for seamless data capture
Validate ETL pipelines and dashboards before scaling
Pilot on a small scale to accelerate feedback
Review performance against goals to refine each stage
Ready to kick off your first BI pilot? Ask our experts at Digifox to guide you every step of the way.
How To Choose The Right BI Tool
Choosing a BI tool for an SME can feel like navigating a crowded market. Vendors all promise the moon. A vendor-neutral checklist helps you zero in on what really matters.
Key Criteria To Consider
Integration Ease: Can the platform plug straight into your CRM, accounting software and Weavely.ai forms?
Scalability: Will it run smoothly when your dataset grows or you add users?
User Interface: Are dashboards so intuitive that your team adopts analytics without a steep learning curve?
Support Quality: Is there UK-based helpdesk support or local partners for workshops?
Pricing Models: Do subscription tiers make sense, or will hidden fees catch you off guard?
Data Source Compatibility: Does it play nicely with spreadsheets, databases and smart forms?
Score each vendor against these criteria using a simple rubric. This highlights clear winners and shows where you might compromise.
Questions To Ask Vendors
How smoothly do you connect with existing tools like Weavely.ai forms and our CRM?
Can we add users or storage without stretching our budget unexpectedly?
What training and support come with each pricing plan?
How do you manage data security and compliance in the UK?
Is there a sandbox or trial period to kick the tyres?
“Testing vendor answers early is like test-driving a car before you commit,” says a seasoned BI consultant.
Running A Fast Pilot
Treat your pilot like a mini-experiment. You’ll learn more in weeks than months of research.
Define the pilot’s scope and three concrete objectives.
Use Weavely.ai forms to capture live data throughout the test.
Wire up your ETL process and spin up a straightforward dashboard.
Invite end users to explore reports and flag friction points.
Measure metrics like time to insight, data accuracy and user satisfaction.
Metric | Pilot Result | Target |
|---|---|---|
Time to Insight | 2 days | Max 3 days |
Data Accuracy | 98 % | Min 95 % |
User Satisfaction | 4.5/5 | Min 4/5 |
Gather feedback with quick interviews or surveys. These insights steer you away from wrong paths and help you land on a BI platform that fits your budget, scales as you grow and slots neatly into your existing toolkit.
Evaluating ROI Potential
A BI tool isn’t just another line item—it should pay for itself. Understanding ROI filters out false promises.
Subscription & Support Costs: Tally monthly fees and any training expenses.
Labour Savings: Calculate hours reclaimed through faster reporting and fewer manual tasks.
Revenue Uplift: Forecast sales increases or cost reductions thanks to sharper insights.
When you put numbers next to each item, you craft a business case that speaks to stakeholders. It clarifies the path forward. Digifox can guide you through every stage with hands-on expertise.
FAQ
What Is Business Intelligence and How Does It Differ from Basic Analytics?
Business Intelligence weaves together data collection, ETL, dashboards and reporting into a seamless workflow. Unlike one-off analytics, BI delivers a constant stream of automated insights—more than just charts.
How Much Does a BI Solution Cost for an SME?
Entry-level cloud packages generally start between €500 and €2,000 per month. You can begin with the essentials and scale up as your data needs evolve.
How Long Before You See Live Insights?
By using templates and smart forms, many SMEs have a basic dashboard live in just two to four weeks.
What Additional Tools Do SMEs Need?
At a minimum, you’ll want:
A secure cloud data warehouse
An ETL connector
An analytics dashboard
Smart form solutions like Weavely.ai handle code-free data capture to simplify the process.
Key SME BI Projects and Timing:
Data Source Setup (1–2 weeks)
ETL Workflow Design (1 week)
Initial Dashboard Build (1–2 weeks)
Timeline To Live Insights
A focused pilot can move from kickoff to go-live in one month. Automating data intake with Weavely.ai forms and standard warehouse connectors accelerates delivery.
ROI Expectations
Smaller firms typically realise ROI within three to six months. The main gains come from cutting manual reporting, slashing errors and speeding up decision-making.
Is BI Implementation Complex?
Not if you use pre-built connectors and draw on support from Digifox or tools like Weavely.ai. Setup can be straightforward—and far quicker than you might think.
Metric | Timeline |
|---|---|
Time to Insight | 4 weeks |
User Adoption | 60–80 % |
Cost Recovery | 3–6 months |
Many SMEs recover BI investment in under six months through efficiency gains.
Ready to take the next step in your AI journey? Capture your first dataset with Weavely.ai forms in minutes or book a free consultation with Digifox at https://digifox.be. Let’s turn your data into confident decisions together.
